

Construction projects involve dozens of trades and thousands of tasks, with schedules that shift when problems arise. The Gantt chart is the tool most teams use to see the schedule at a glance. This guide explains what a Gantt chart in construction shows and how teams track progress.
Readers will find a plain language breakdown of Gantt chart components, a worked example that follows a typical construction sequence, and practical guidance on building and updating a schedule that holds up once work begins. The goal is a resource project managers and schedulers can use without wading through marketing.
What is a Gantt chart in construction?
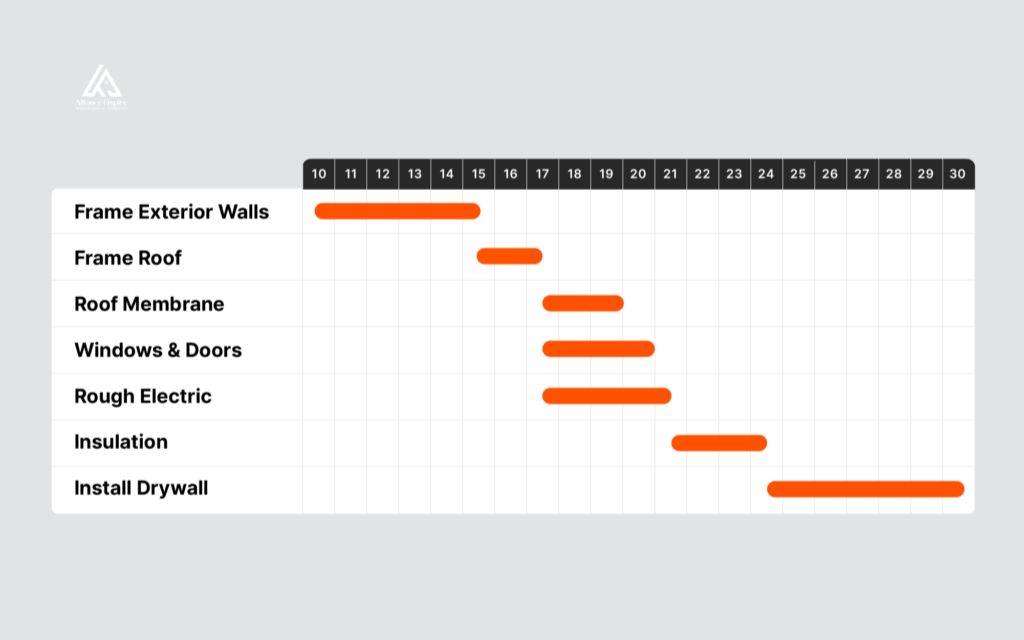
Gantt chart in construction describes a bar chart that lays out every task along a timeline, with each bar showing a start date, duration, and finish date. Construction teams use it to see which trades are working on which days.
The chart also shows which tasks depend on others finishing first. Unlike a simple task list, it shows time visually, so delays and overlaps become obvious before they turn into change orders.
The terms Gantt chart and construction schedule often get used interchangeably, but they describe different things. The construction schedule is the underlying plan, the full set of tasks, durations, sequencing logic, and resource assignments that defines how a project will be built.
The Gantt chart is one way of displaying that schedule, using horizontal bars set against a calendar. Project teams can generate other views, such as a critical path network diagram or a summary milestone list, from the same underlying schedule data.
Recognizing this distinction matters when reviewing a schedule submission, since a chart that looks complete can still be missing the dependency logic that makes the underlying schedule usable.
Why construction teams use Gantt charts
Construction teams turn to Gantt charts because they solve a communication problem as much as a planning one. Written schedules with hundreds of line items are hard for a superintendent to scan on a Monday morning.
Status shows in seconds through color coded bars on a Gantt chart in construction. The benefits generally fall into a few categories:
- Visualizing the full project timeline in one view
- Coordinating multiple trades working in the same space during the same week
- Making task dependencies and overlaps easy to spot
- Tracking milestones such as permit approvals or phase completions
- Monitoring progress against the original plan
- Communicating schedule status to owners, lenders, and subcontractors without a lengthy explanation
Each of these benefits compounds over the life of a project, since a schedule that is easy to read gets checked more often, and a schedule that gets checked often is easier to keep accurate.
Core components of a construction Gantt chart
Tasks and construction phases
Each bar on a Gantt chart represents a task or activity, grouped under a larger construction phase such as sitework, foundations, or finishes. Tasks are typically defined during preconstruction, when the project team breaks the scope of work into a work breakdown structure, sometimes called a WBS.
Grouping too much scope into one task, such as a single line item covering all mechanical, electrical, and plumbing rough in work, hides the coordination needed between those three trades. Breaking tasks down too narrowly buries the chart in detail that field teams do not need.
Start dates, finish dates, and durations
The horizontal length of each bar represents the duration of a task, running from its scheduled start date to its finish date. Durations should reflect realistic production rates tied to crew size, quantity of work, and shift length, not a rough guess at calendar days.
Durations built on solid production data hold up when the schedule gets tested by weather delays or material shortages, while guessed durations usually need revising within the first few weeks of work.
Dependencies between tasks
Dependencies are the connections between tasks that determine the order work must happen in. Finish to start is the most common relationship in construction sequencing, meaning one task cannot begin until another finishes, such as framing waiting on foundation curing.
Other relationship types include start to start, finish to finish, and start to finish. Without dependencies mapped out, a Gantt chart is just a list of bars with no logic connecting them. Delays in one task then become impossible to trace through the rest of the project.
Milestones
Milestones mark significant points in a project, such as a permit approval, a foundation pour, or a certificate of occupancy. On most charts they appear as a diamond shape rather than a bar, since they represent a single point in time rather than a duration.
Milestones give owners, lenders, and project teams fixed reference points to measure progress against, and they are often tied directly to contract terms or payment schedules.

Tracking progress and spotting delays with a Gantt chart
Locking a baseline for accurate comparisons
Before tracking progress, the project team should lock a baseline version of the schedule, meaning the originally approved plan for task dates and sequencing. Every update afterward gets compared against that fixed reference point rather than against whatever the schedule looked like a week earlier.
Without a locked baseline, it becomes difficult to tell whether a project is actually behind schedule or simply operating under a plan that has quietly shifted over time.
Comparing planned vs. actual progress
Updating a Gantt chart typically means recording actual start and finish dates for completed tasks, adjusting remaining durations for tasks still in progress, and noting any new dependencies created by field changes.
Weekly updates are a reasonable minimum during active construction, since a chart updated only once a month lags well behind actual site conditions.
When a task runs long, the updated chart shows immediately which downstream tasks are affected, giving the team time to adjust crews or resequence work before the delay compounds.
How Gantt charts relate to other planning methods
Critical path method (CPM)
The critical path method identifies the sequence of tasks that determines the shortest possible time to complete a project, based on task durations and dependencies.
Delays to a task on the critical path push back the overall project finish date, while delays to tasks off the critical path can often be absorbed using float time built into the schedule.
Highlighting the relevant bars on a Gantt chart displays the critical path visually, giving field teams the same logic a CPM network diagram calculates mathematically, presented in a different format.
Connection to BIM (4D scheduling)
Some project teams link Gantt chart schedule data to a building information model, creating what is often called a 4D model, where the three dimensional building design is paired with the fourth dimension of time.
This lets stakeholders see how a project will physically come together phase by phase, which can help catch spatial conflicts or sequencing problems before they show up on site.

Coordinating resources and subcontractors on a Gantt chart
Construction schedule Gantt chart tools only work if the trades doing the work can see how their piece fits into the larger sequence, which is where resource and subcontractor coordination becomes important.
Resource loading adds labor and equipment information to each task on the chart, showing which crews are needed and when.
This helps a general contractor spot conflicts early, such as two subcontractors both needing the same section of the building during the same week, or a specialty trade scheduled before the crew that needs to finish ahead of them.
Sharing an updated construction Gantt schedule with subcontractors, rather than relying on verbal updates, gives every trade a shared reference point for when their scope of work starts and finishes, and helps them plan crew and material deliveries around the rest of the project.
How to create and update a construction Gantt chart
Building a Gantt chart in construction that holds up once work starts takes more than typing tasks into a timeline. The process generally follows these steps:
- Build the work breakdown structure: Divide the project scope into manageable tasks by phase, trade, or location.
- Assign realistic durations: Base each duration on production rates, crew size, and quantity of work rather than a guess.
- Set dependencies between tasks: Link tasks in the order work must happen, using finish to start relationships where possible.
- Add milestones. Tie key dates to contractual events such as permit approvals or substantial completion.
- Choose scheduling software: General project management tools and construction specific platforms can generate a Gantt chart for building construction automatically once tasks, durations, and dependencies are entered.
- Update the schedule regularly: Review the chart on a consistent cadence and document any changes to logic or duration rather than simply dragging bars into new positions.
Conclusion
Every Gantt chart is only as useful as the schedule behind it, and building that schedule accurately takes hands on construction experience, not just software training.
Alliance EDS has spent more than 15 years building and managing construction schedules for projects across Denver, Colorado, and the surrounding region, from sitework through final closeout.
Property owners and project teams looking for a construction partner that treats scheduling as a working tool, not paperwork, can reach Alliance EDS at (720) 484-8181.
Frequently asked questions (FAQs)
What is a Gantt chart in construction?
Gantt chart in construction refers to a bar chart that displays every task in a project along a horizontal timeline, showing start dates, finish dates, durations, and the dependencies that connect one task to the next.
What is the difference between a Gantt chart and a construction schedule?
The construction schedule is the full underlying plan, including tasks, durations, sequencing logic, and resources, while the Gantt chart is the visual bar chart format used to display that schedule. The same schedule data can also be shown as a network diagram or a milestone list.
What is the difference between a Gantt chart and a CPM schedule?
CPM, or critical path method, is a calculation approach that identifies the sequence of tasks driving the project finish date.Gantt chart is a display format, and it can show CPM results using highlighted bars, though a bar chart without dependency logic behind it is not the same as a true CPM schedule.
How often should a construction Gantt chart be updated?
Weekly updates are a reasonable minimum during active construction, since a chart updated only monthly falls behind actual site conditions. Projects still in preconstruction or long procurement phases can often work with a less frequent update cycle until active construction begins.
Can one Gantt chart cover multiple project phases?
Yes, provided the underlying work breakdown structure is organized by phase and the scheduling tool supports collapsible groupings. This setup allows leadership to view high level milestones across the whole project while field teams work from task level detail within their current phase.
What software is used to create a construction Gantt chart?
Scheduling tools range from general project management software to construction specific platforms, and most generate a Gantt chart automatically once tasks, durations, and dependencies are entered into the system. The right choice usually depends on project size, integration needs with cost and procurement data, and how the wider project team already works.